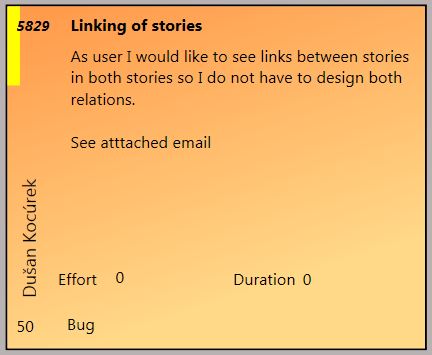
An index card
Fundamental principle of Agile
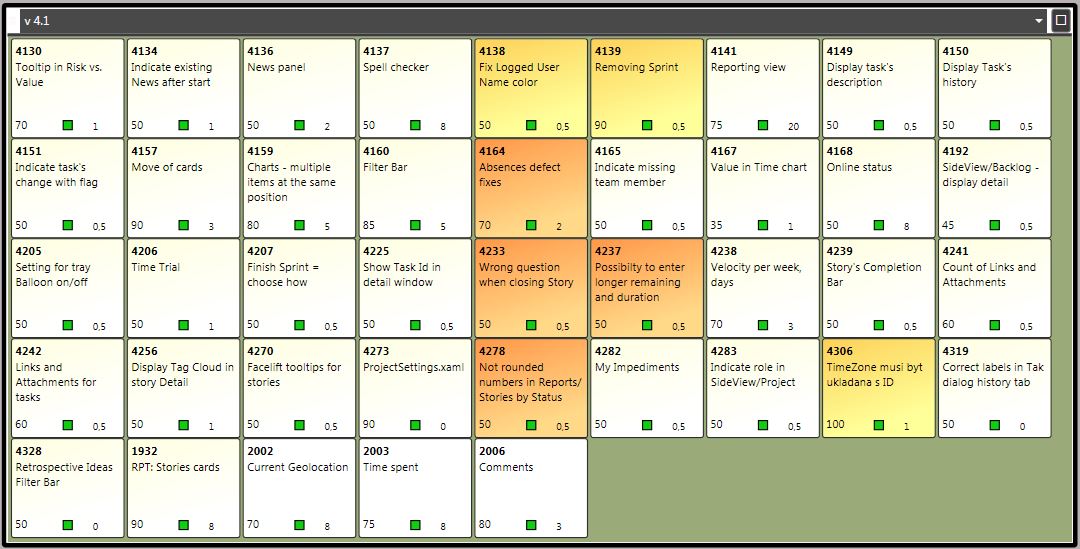
Backlog items are represented as index cards. Great overview of the backlog is achieved by card colors, different sizes and position on the board.
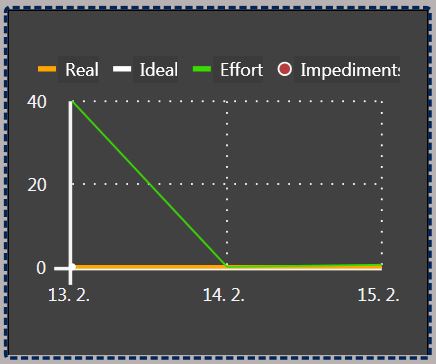
ScrumDesk card is multi-pages card so user story can be broken immediately into tasks or measure progress on it.
It is the best electronic card on the market because it displays not just important requirement details.
Story templates
Keep discipline in backlog through story templates!
The team is quickly able to create a new card by selection of story template and voila! Everything is prepared immediately.
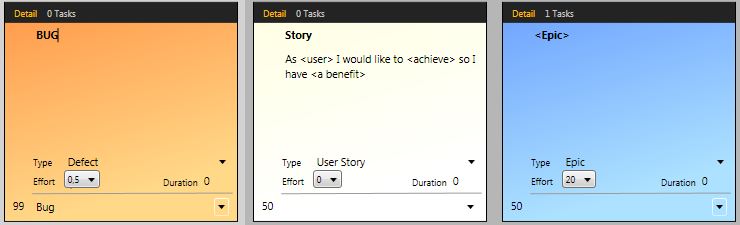
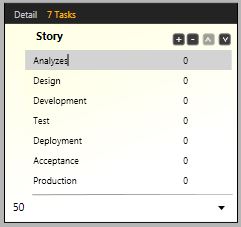
Templates that include predefined tasks helps team members to work according to the definition of done or definition of ready.
Markers
Give context and semantic to the board.
Not everything is needed to be put on a card. Sometimes you need a just marker or tag. Sometimes you need to just draw a line. Or put red circle to tell others about an important part of the board.
ScrumDesk provides a way to put dozens of markups (tags, labels) on a board.
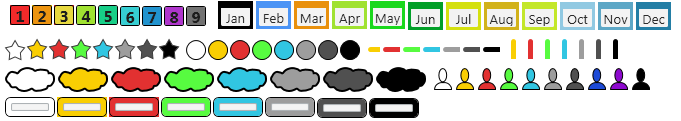
Some markers are interactive so you can enter text. All of them are resizable and movable.
Story boxes
Story boxes are markers on steroids.
Boxes are able to stack stories into groups that can be moved around the board as a group. As a stack of cards.
Boxes group stories from selected sprint or release. They even can be used for quick planning.
Just drag story card into release box and that its. The story is planned for release.
Boxes also display release or sprint progress statistics and provide quick access to all release or sprint details.