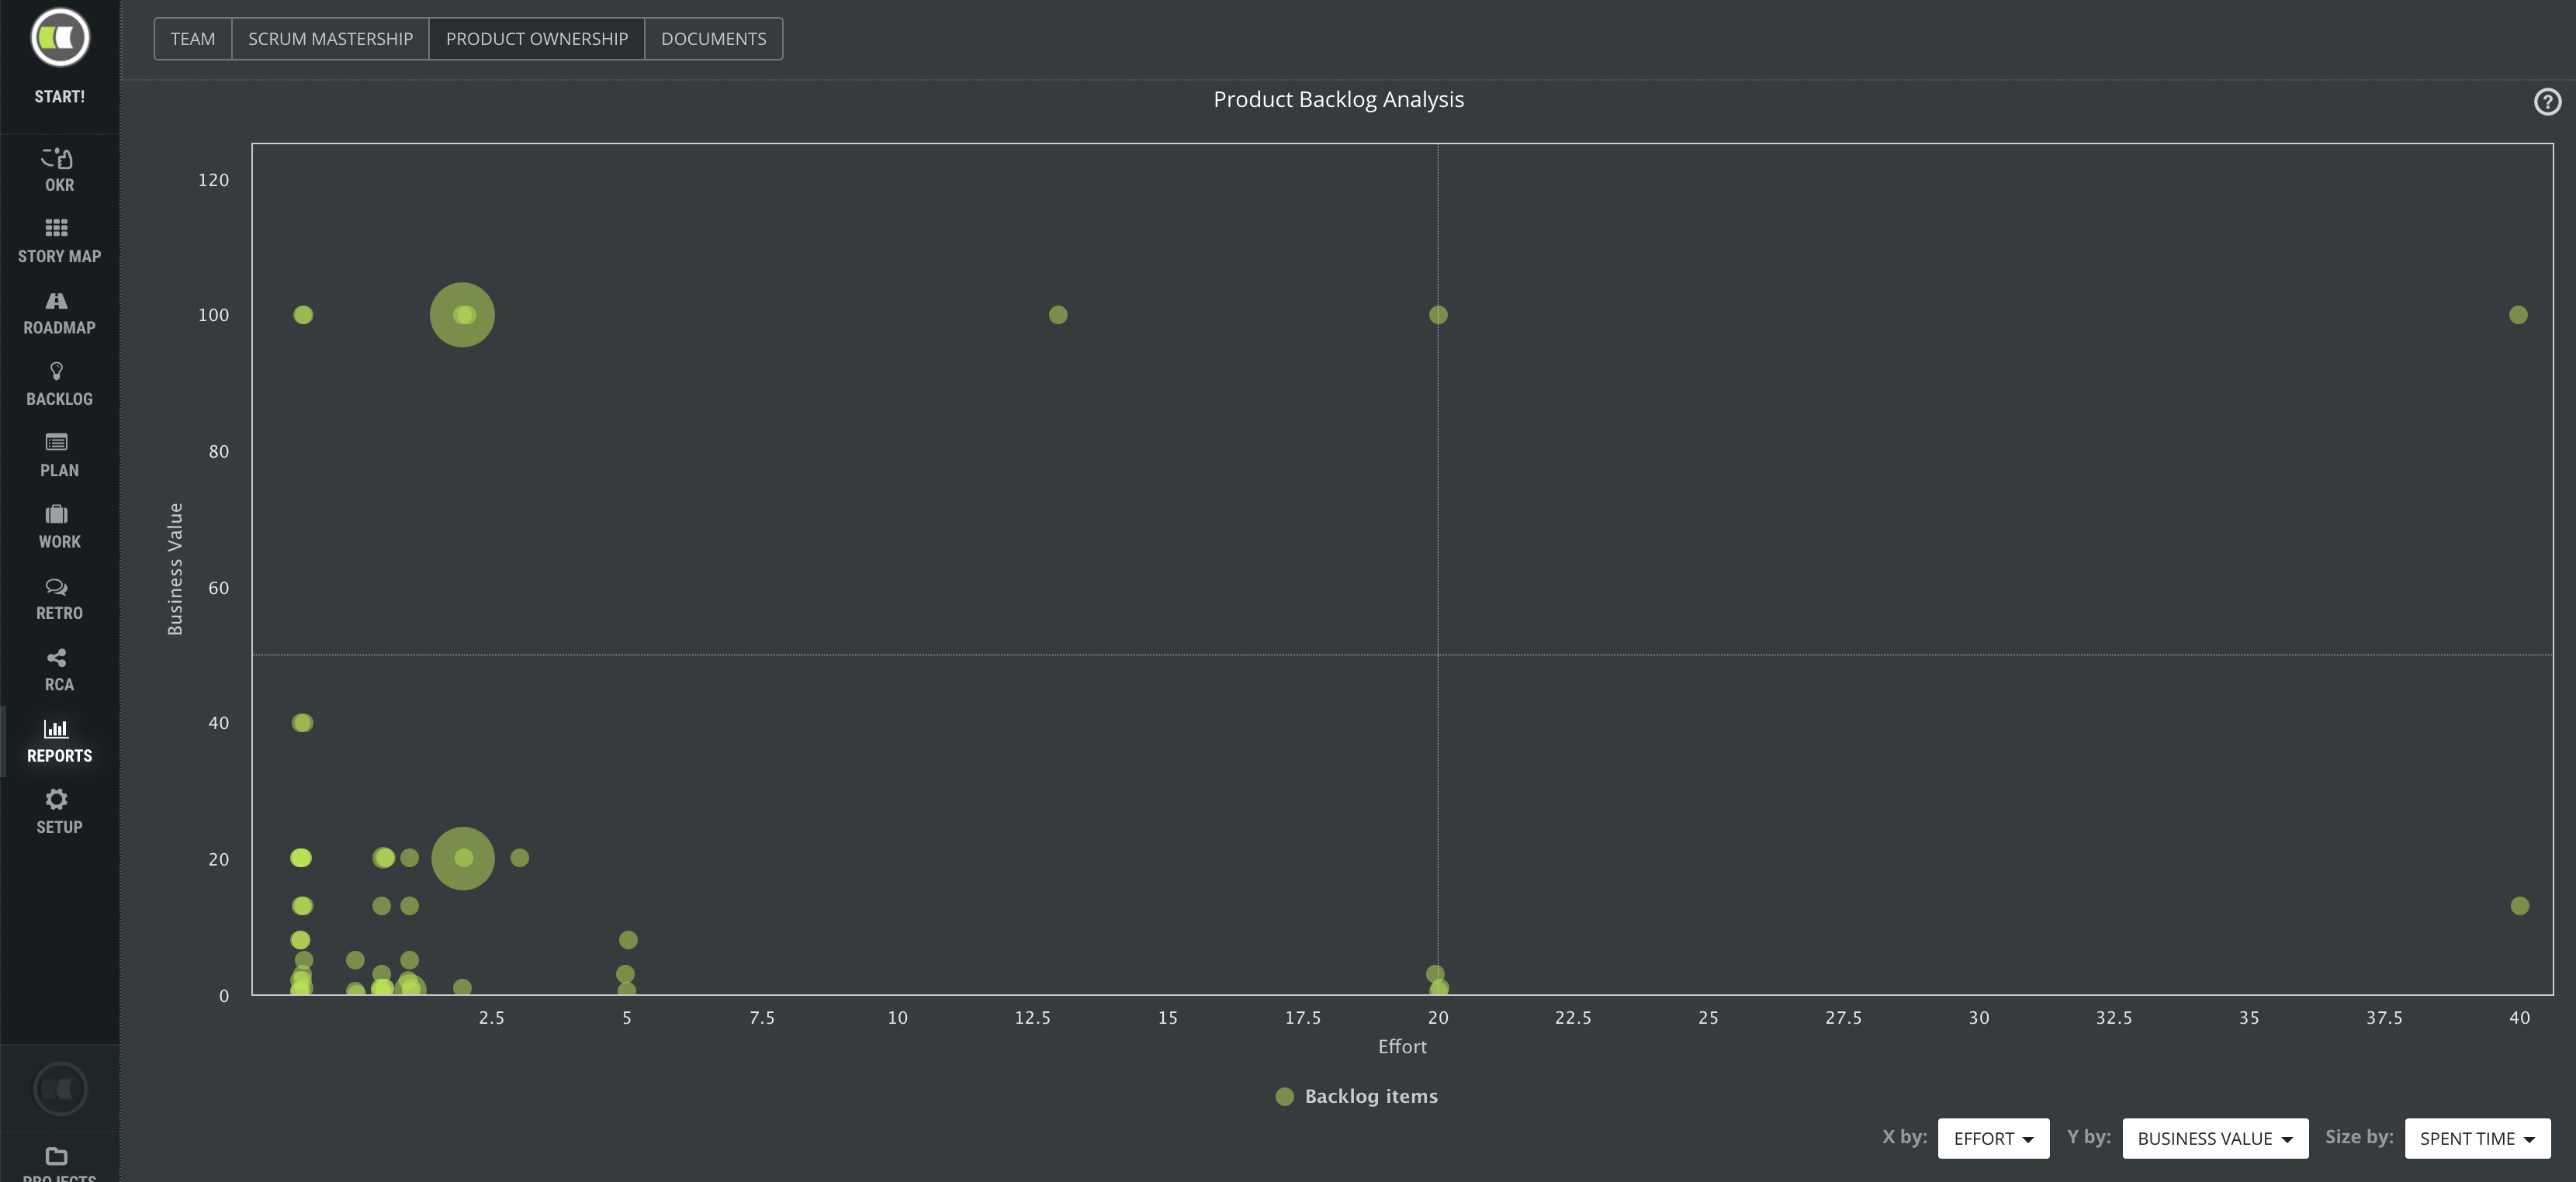
The Product Backlog Analysis Chart
Product backlog usually grows into hundreds of items soon after the product development has been started. It is very challenging for the product owner to have an overview and understanding of backlog items with such high numbers. Moreover, the backlog items need to be understood from multiple perspectives, i.e. business value, risk, effort, time, status, etc.
What this chart can answer?
- What high business value items can be delivered for the smallest effort?
- Is our effort estimation (in story points) consistent from a time perspective (estimated time)?
- Which backlog items can be reference backlog items for further estimation?
- How much time did we spend compared to the estimated time?
- Are risky backlog items worth to invest?
- Which risky items have the biggest business value and which are even not necessary?
- Is an effort worth to be invested into risky stuff?
- Do we consider risk in our time estimation properly?
To answer those questions you can compare three values displayed on the X axis, Y axis and third one represented by the size of a circle.
Possible parameters you can choose for the comparison:
- Business Value
- Effort
- Risk
- Estimated time
- Remaining time
- Spent time
Click any green circle to display further details of the backlog item. Parameters without defined value are displayed with value -1 in the chart.
Few examples
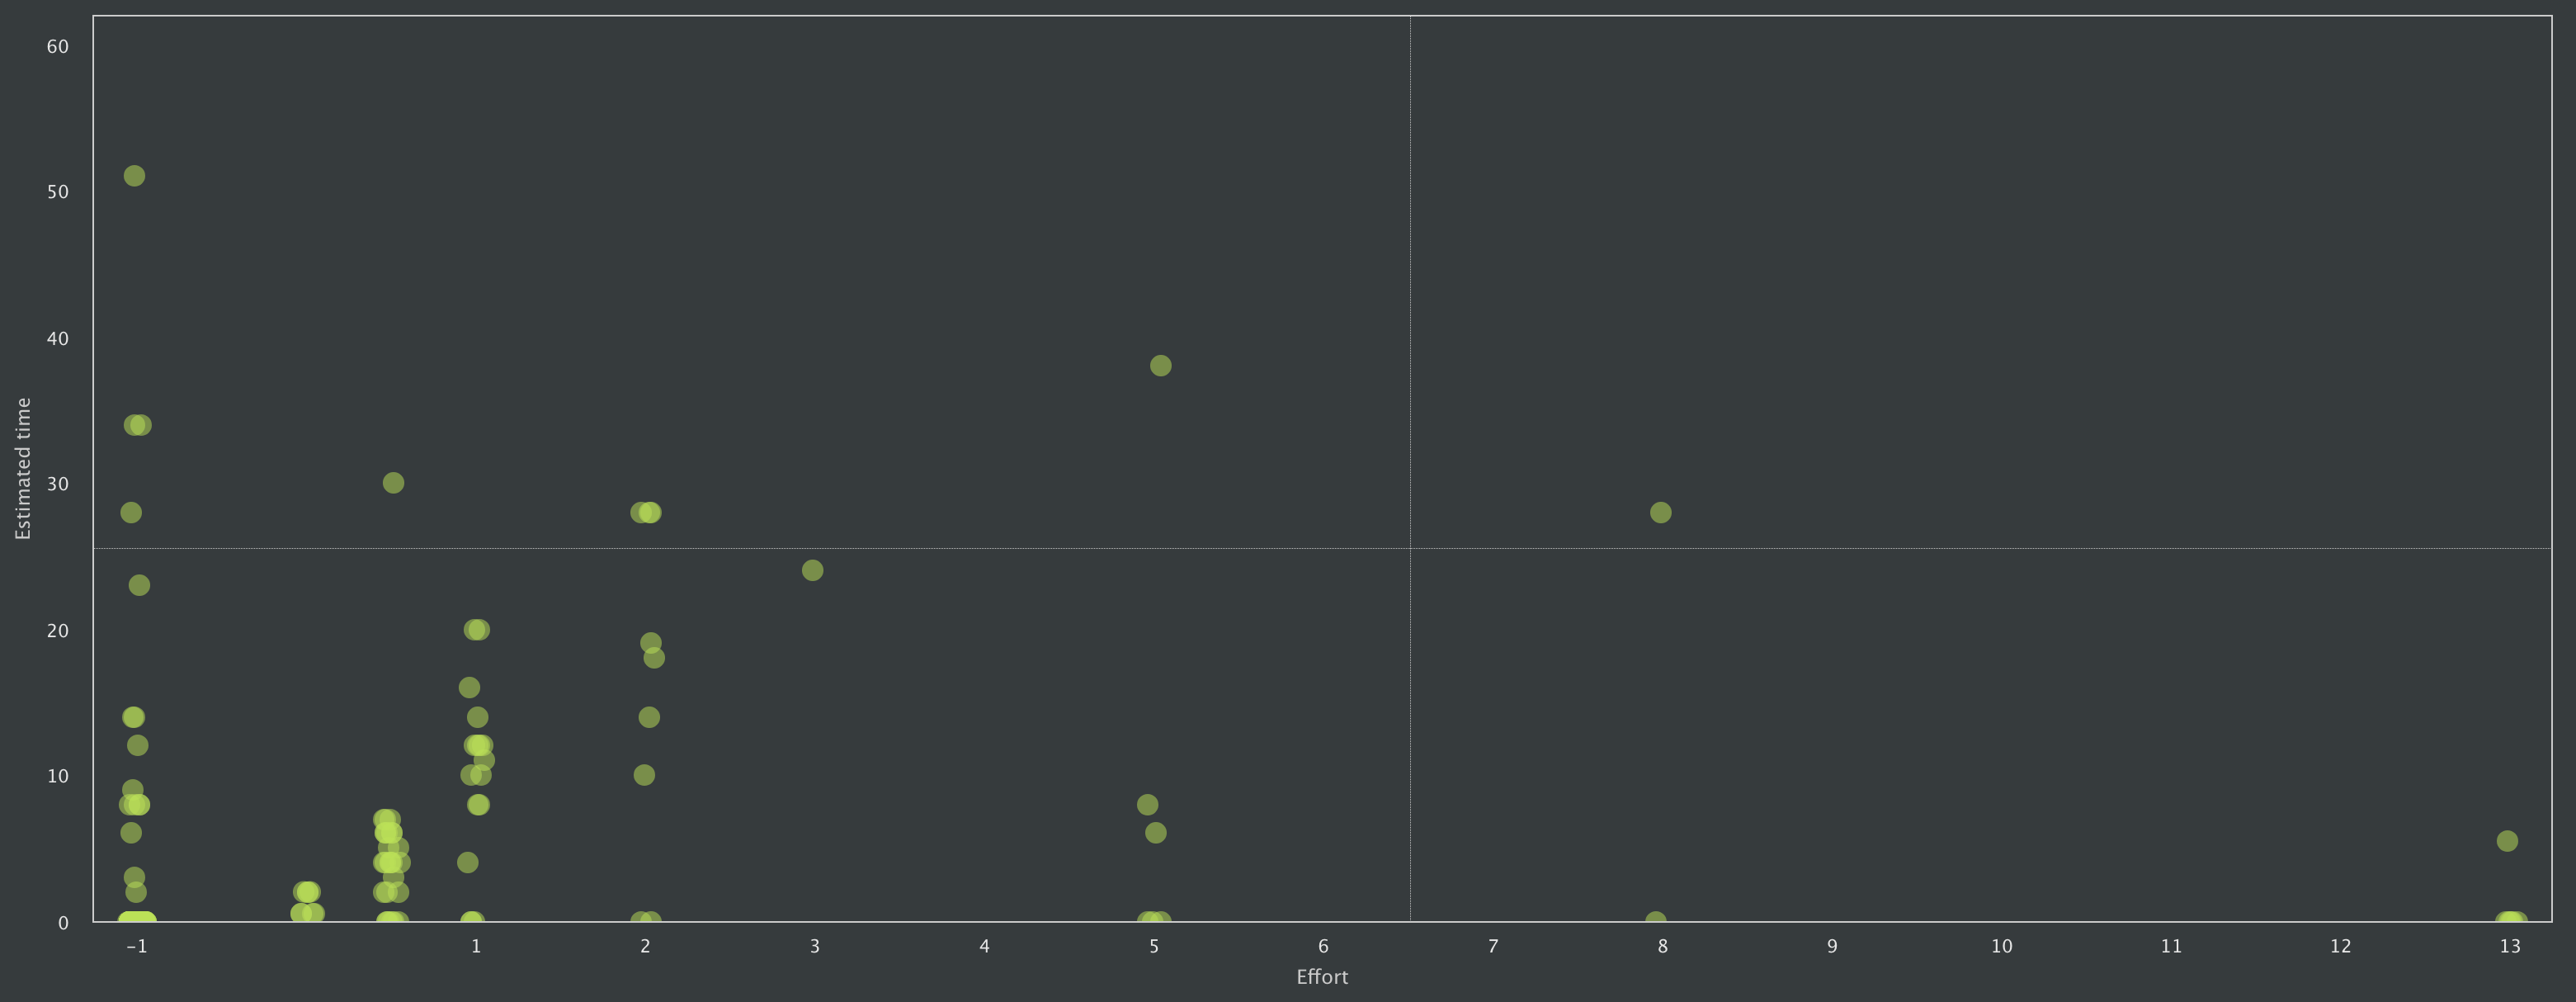
Estimated time is widely spread for every story point. Ideally, the time should be roughly multiplication of estimated time from the previous effort. This chart shows improper estimation and missing estimation references in the team. Estimated time for 13 story points is similar to the estimated time for 0.5 or 1 story point.
Estimation precision
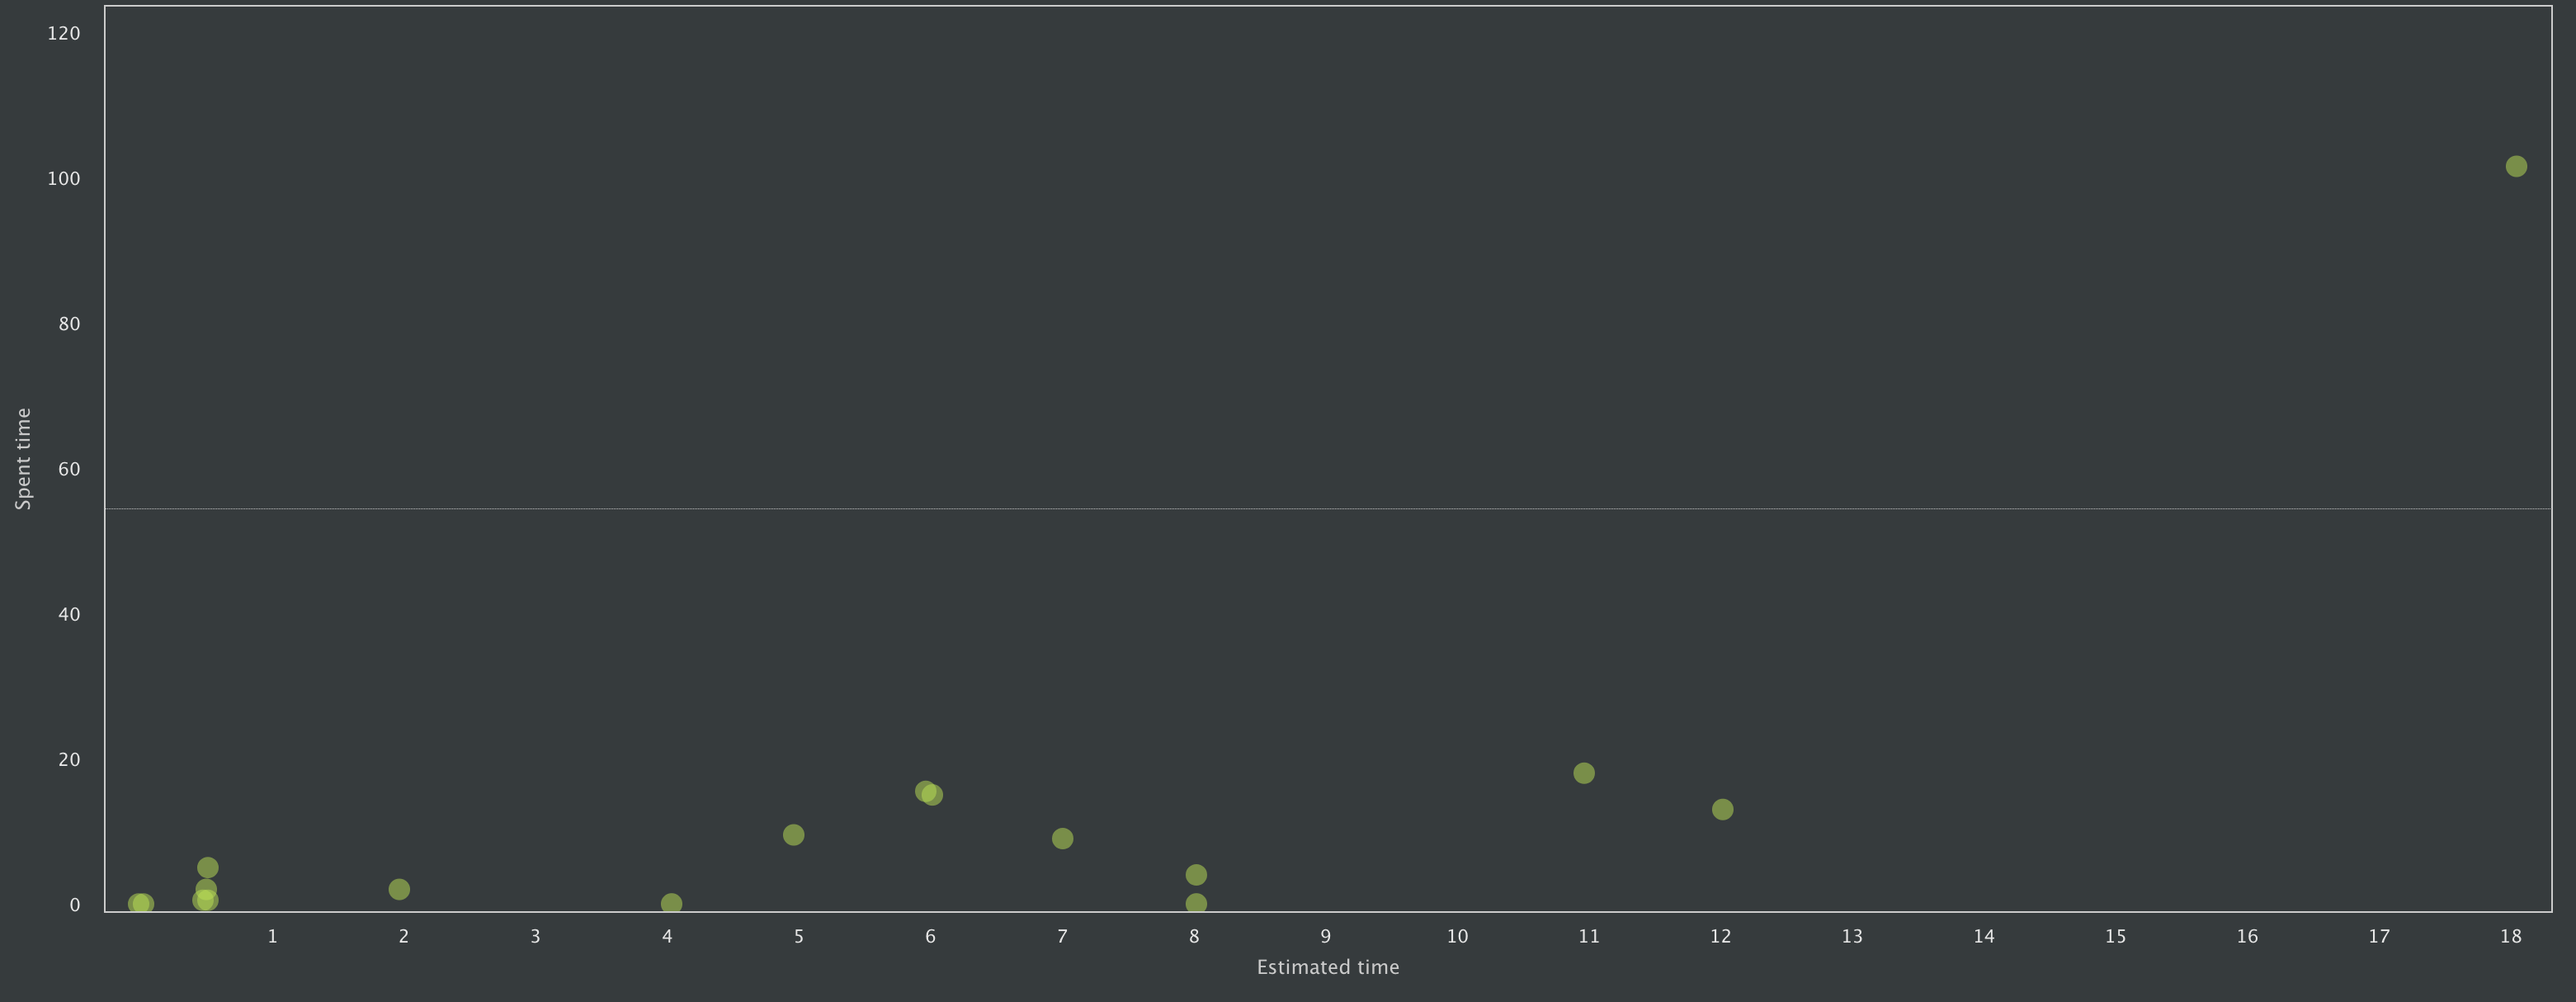 This chart compares estimated vs. spent time. This way we see the difference between the estimation and real-time the team invested in the development of the product backlog item. The last dot displayed in the top right corner indicates that either the backlog item estimation was 18 hours, the team spent 100 hours.