The Sprint Burn Down Chart
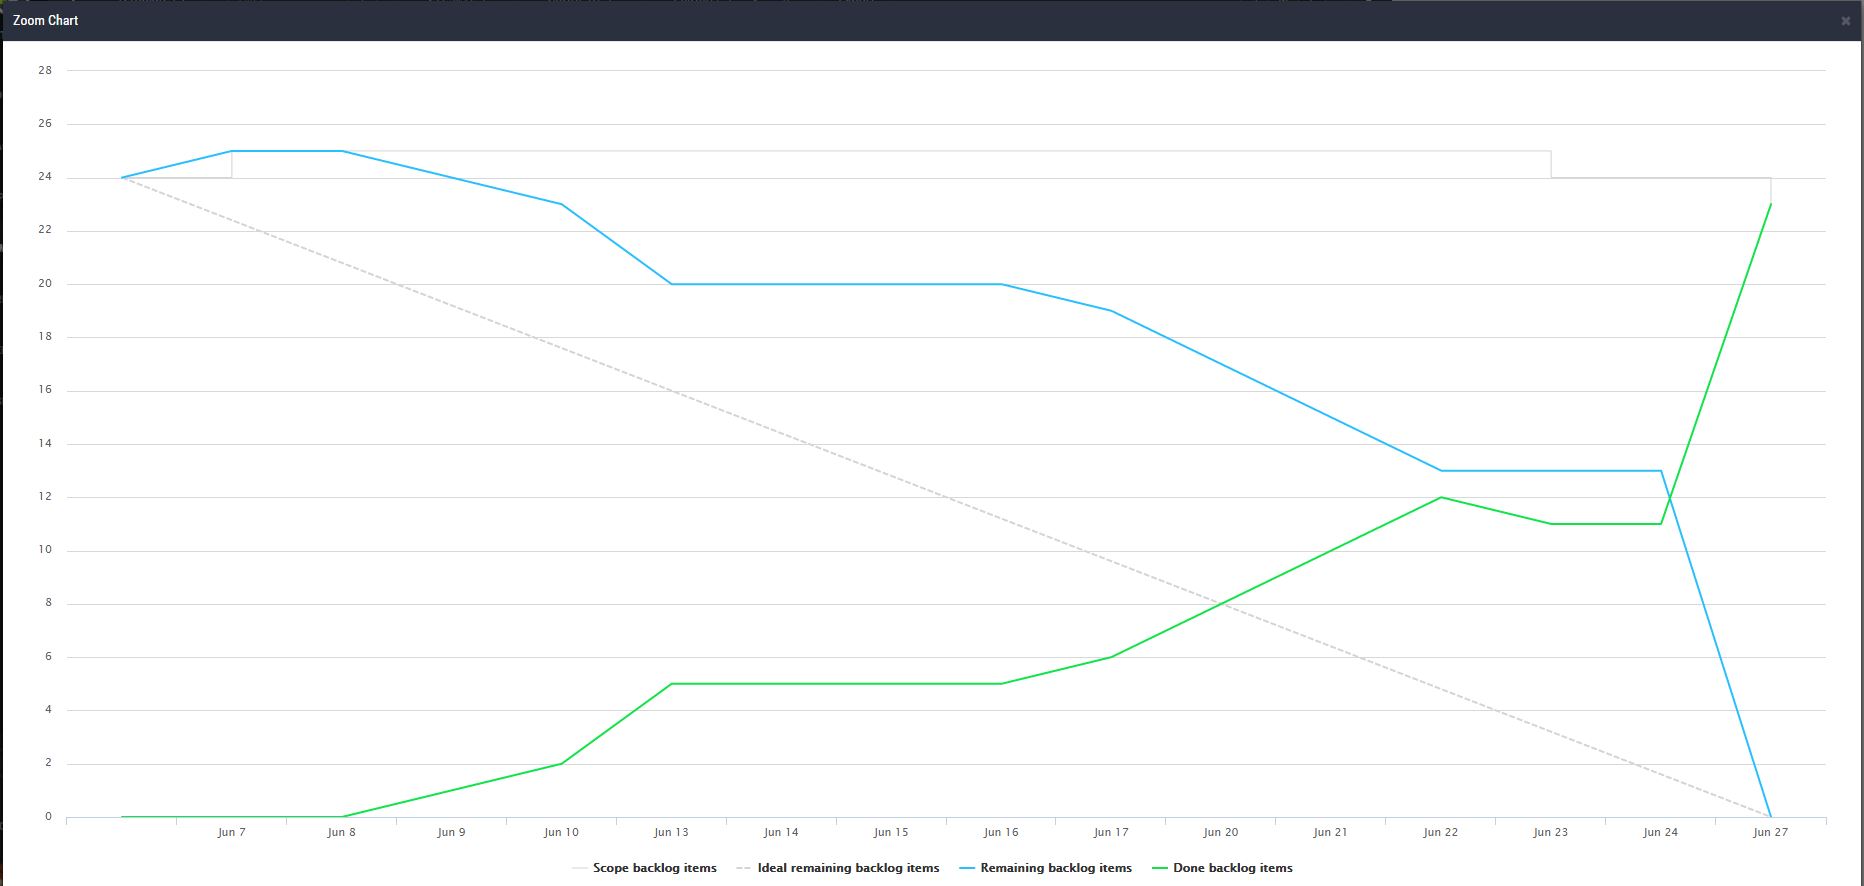
Sprint Burndown chart is the most important chart for the agile team that displays remaining work in a particular sprint. Agile teams need to track different values based on their agile implementation:
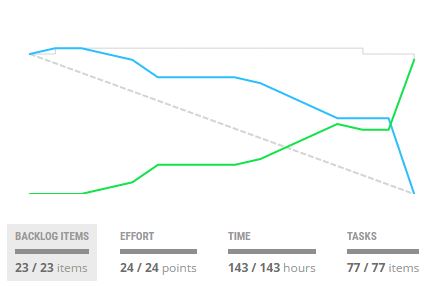
- Backlog items – some teams do not track tasks, they are more interested in the progress of backlog items (user stories).
- Effort – tracking of story points for completed backlog items.
- Time – tracking of the remaining time for tasks in selected Sprint.
- Tasks – the number of tasks that need to be done in selected Sprint.
Burndown chart information
Based on our agile coaching experience, the burndown chart used in ScrumDesk provides additional information compared to the standard burn-down chart.
- The diagonal dashed gray line from the top left to the bottom indicates an ideal effort that the team should follow up.
- Blue line displays the real remaining effort (# of tasks, story points, remaining time or a number of tasks).
- The green line represents work spent in the sprint.
- The filled gray line at the top indicates the total size of the sprint backlog. In an ideal Scrum this line will be flat, but in real life, the sprint scope is often changed. Comparing this line to the blue line team can realize why their progress is slower than expected.
The chart can be zoomed which is valuable for your daily stand-ups.