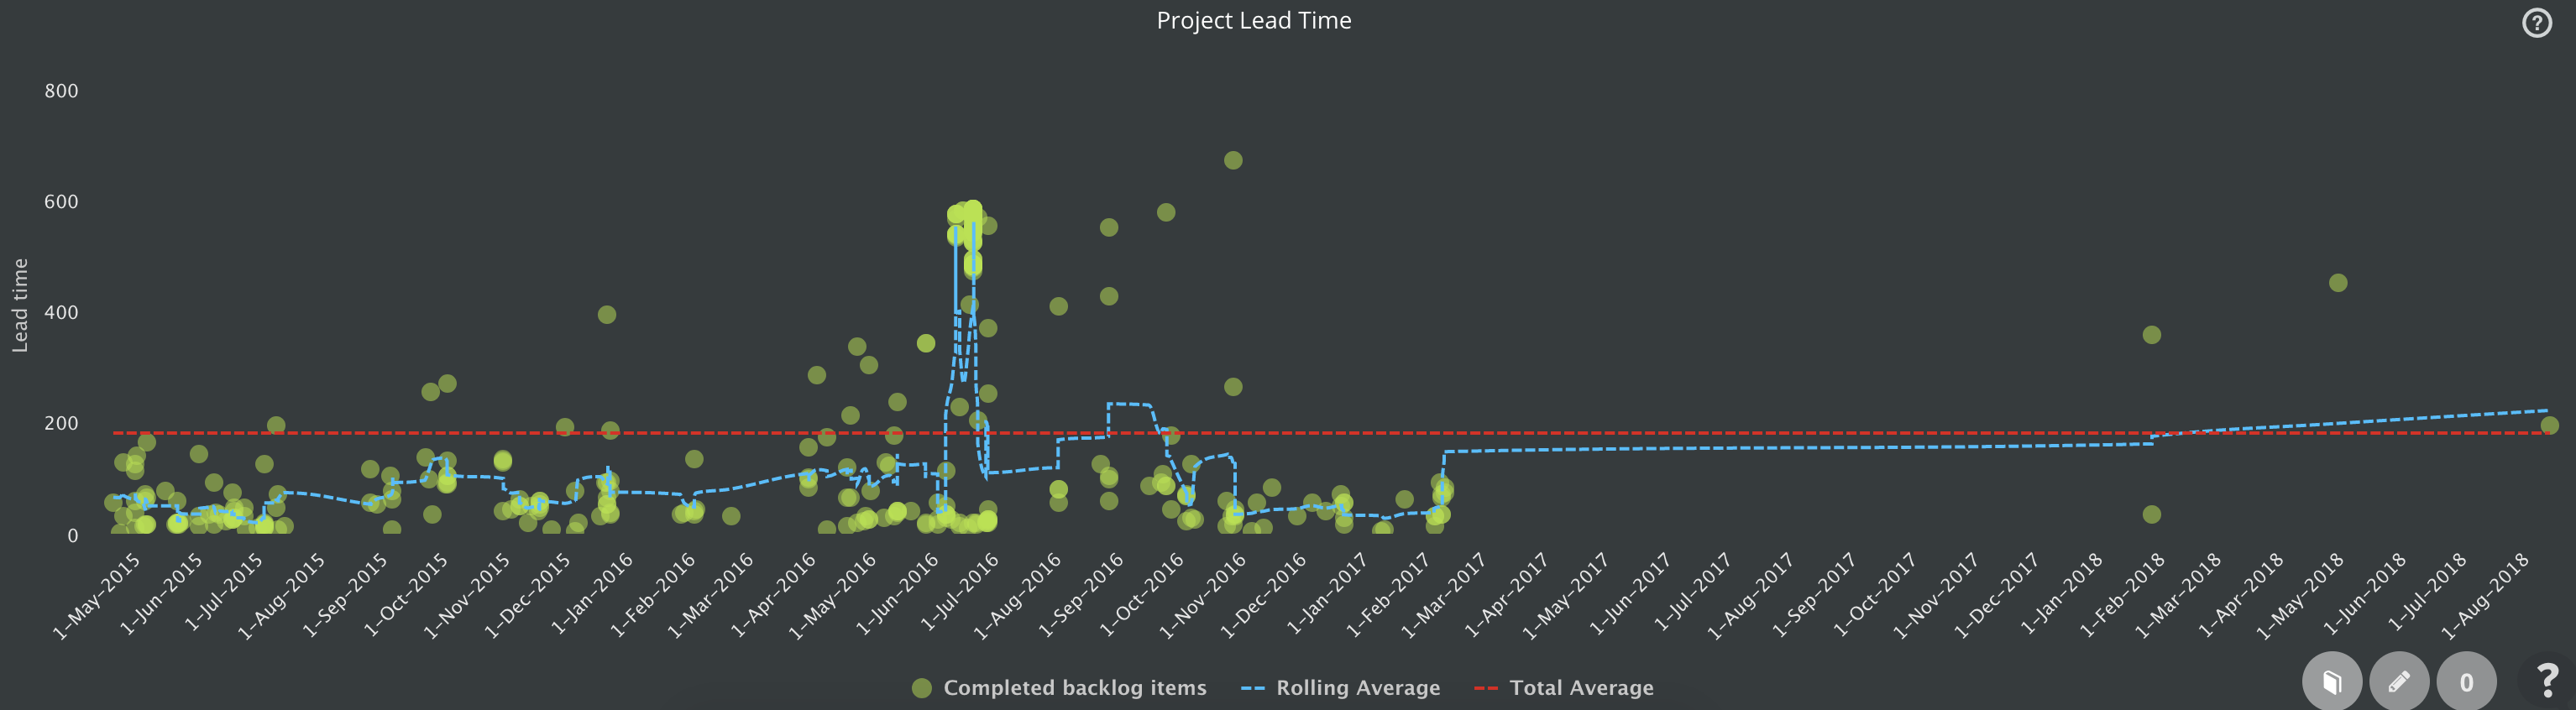
Project Control Lead Time Chart
Do you work on proper backlog items? Are they too old? Maybe it would be wiser to remove them from the product backlog.
Is the development process effective enough? Do you know to answer the question “When will I get it?”. All these questions are asked very often in proper agile teams. Project Lead Time chart displays backlog items and lead time.
Project Control Lead Time Chart in ScrumDesk
The lead time is the duration from entering the backlog item to the Done status.
The chart displays:
- X-axis displays days when the backlog item has been closed.
- Y-axis displays the lead time, a number of days it took to close the backlog items.
- Green circles represent backlog items.
- The red line indicates the total average lead time counted from all backlog items from the beginning of the project.
- The blue line is rolling average lead time calculated from
- The current backlog item plus
- four previous items plus
- four next items.
Click markers to display details of any backlog item.
How to understand it?
Any peak towards the top of the chart indicates that you work on older items or it takes too long. One example is displayed for Jun on the picture above where the team closed backlog items that were 600 days old.
It is very questionable if even team should start to work on them as meanwhile the situation on the market might changed significantly.
Another example. There is no backlog item closed between March 2017 and February 2018 as there is no marker displayed on the chart. The project has been paused probably.
The red line indicates that the team works on 200 days old backlog items on average. Most of the iterations are concentrated on not very old items which are good.