Project Overall Status Charts
To consider further investments in the project, it is important to understand the overall status of the product backlog. With Project Overall Status chart available in the REPORTS/PRODUCT OWNERSHIP section ScrumDesk provides multiple perspectives for product owners to find answers.
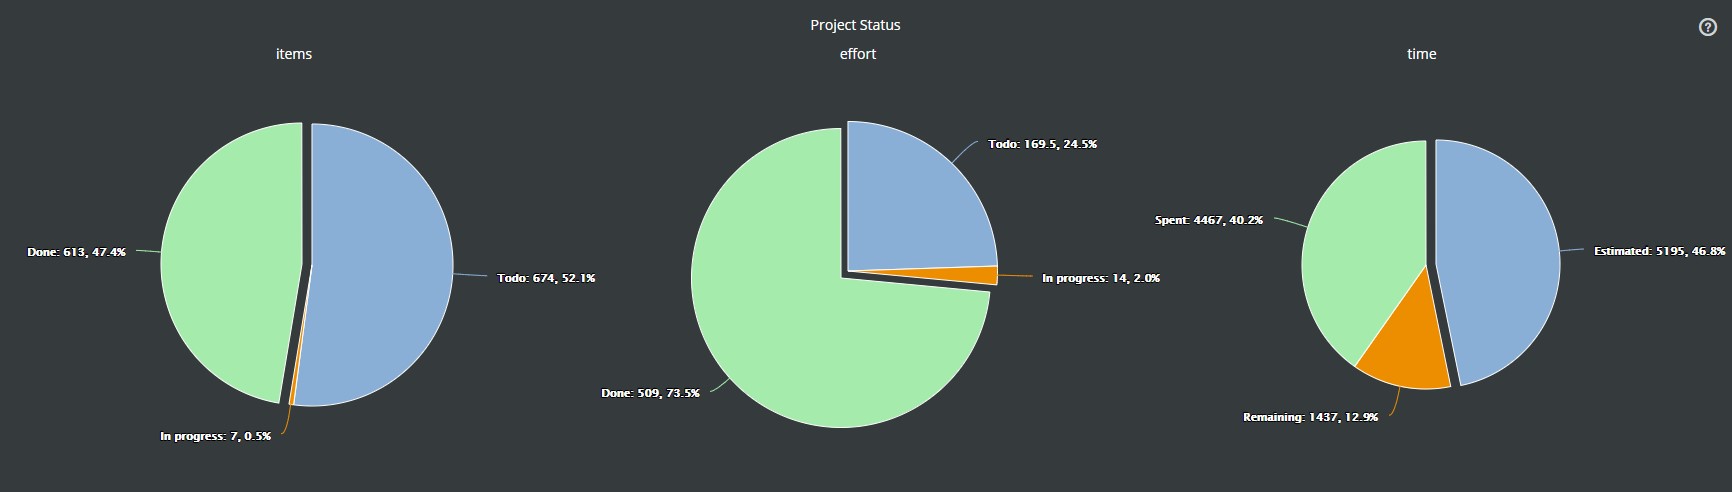
Items
The first perspective is about the number of backlog items in a particular status. This chart helps the Product Owner understand how much it was completed comparing what is still being planned or currently developed. All items, including archived, are evaluated in this chart.
Effort
To know the number of backlog items is not enough as their size might be significantly different. The second chart provides a view of the product backlog from the effort perspective. It summarizes the number of story points assigned to backlog items and their distribution based on the status of items.
Be aware, that only backlog items with assigned effort are included.
Time
The last chart describes the overall status of the product backlog from a time perspective. The chart compares the estimated time to the remaining and the spent time. The product owner can see how much investment is necessary.
Only backlog items with estimated or tracked time are considered.
Why all these perspectives?
There is not very common (and it even doesn’t make sense in an agile project) to have all backlog items estimated nor in story points neither from the time perspective. That is the main driver to combine these three perspectives to have an understanding if the project is near its completion or not.