Spent versus Estimated Time
How much is your estimation precise? Who is usually overestimating or underestimating? By how much?
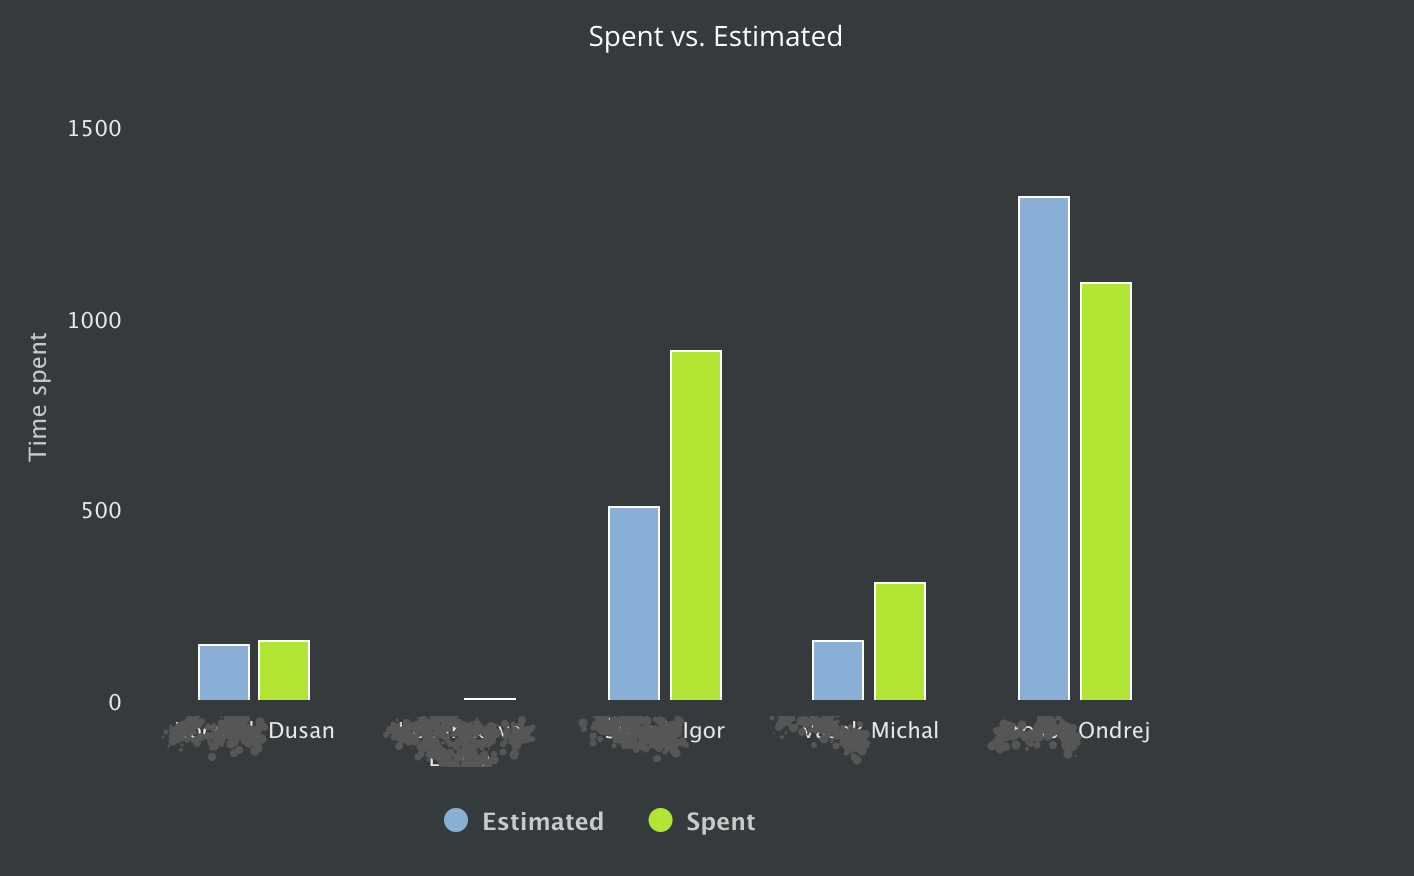
These questions are answered by the Spent vs. Estimated chart.
It compares the estimated time to the total time spent per team member.
The time is calculated from subtasks of backlog items for active members. Guests are not included in this report.
The chart can be found in the Reports, Product Ownership area.