The Product Backlog Treemap
One of the most difficult activities of the product owner is to understand their product backlog. How to identify the top most important features that should be implemented? How to choose the right thing? That requires comparing hundreds of backlog items based on different attributes. But how can you see all of them at once?
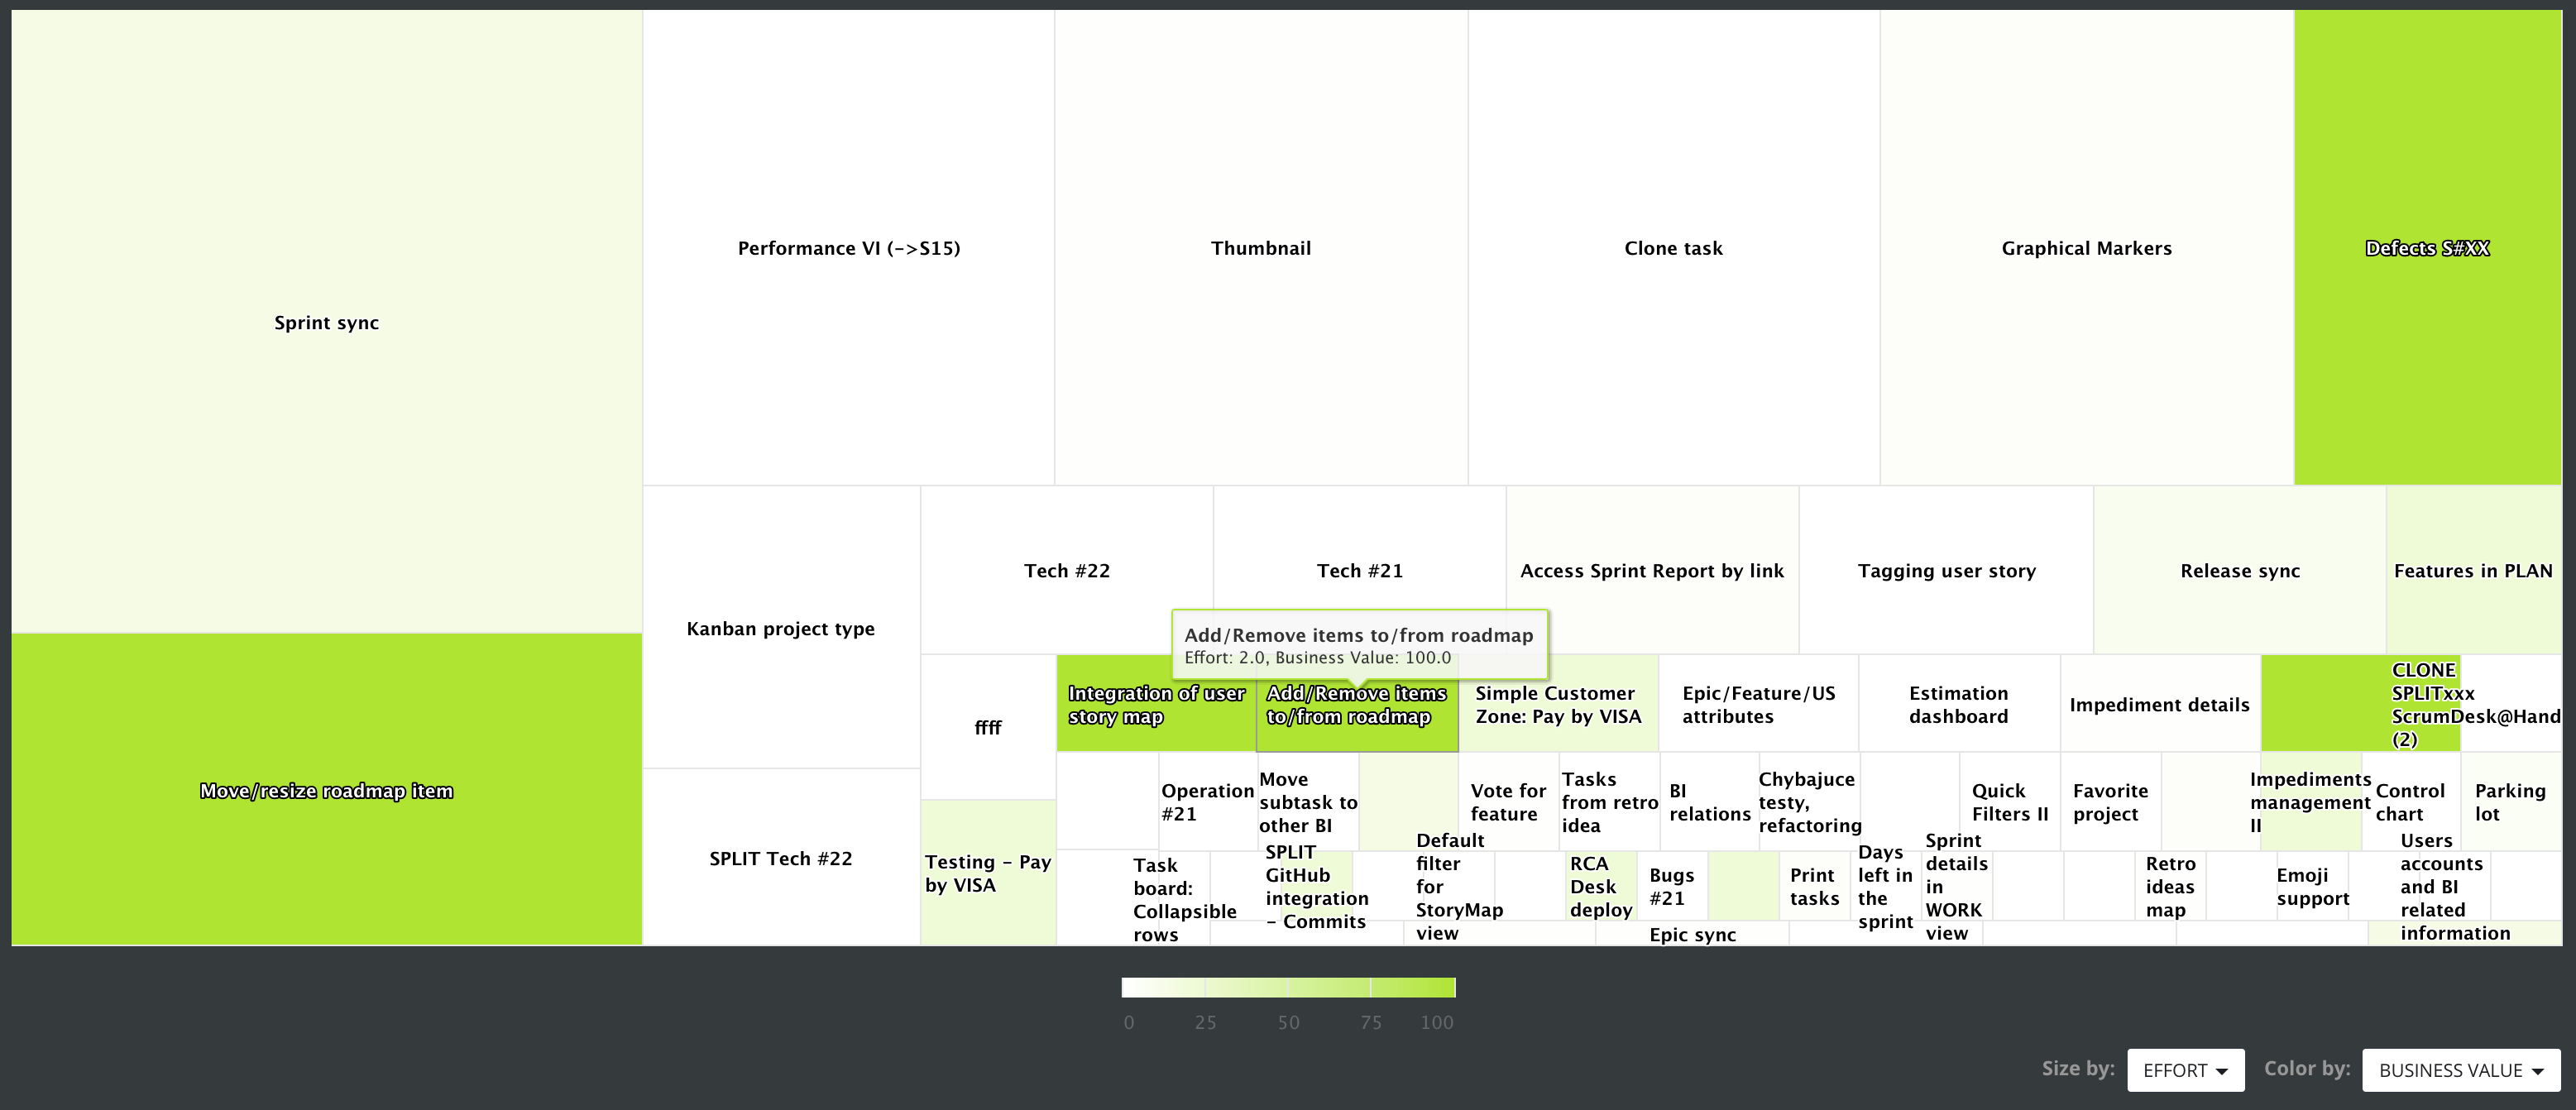
The Backlog Treemap
The treemap view displays backlog items in one view as rectangles with different sizes and colors. By comparison of sizes and color, the Product owner can identify proper items for the next iteration, or understand if team members work on the topmost important items. Or if they are properly estimated from the business, risk, or effort perspective.
The size can be based on a selection from the following attributes:
- Business value, a value estimated by the product owner that will be achieved when the backlog item is published.
- Effort estimated complexity in story points that is necessary for the development of the backlog item.
- Risk, estimated risk level impacting either the development or business side of the product.
- Estimated time, the time estimated by the team to implement the backlog item.
- The remaining time, the time necessary to complete the item which is in progress.
- Spent time, the time that was spent by the team while developing the item.
In addition, rectangles can be colorized to understand the value of the second attribute selected from the Color by option. The greener color means a bigger value.
So if you want to understand the relationship between two attributes, set the one to Size and another one to the Color parameter. That way you can compare spent vs. estimated time, business value vs. effort, business value vs. risk, or an estimation precision by comparison of effort in story points vs. spent time.
The color can be based on a selection from the following attributes:
- Business value, a value estimated by the product owner that will be achieved when the backlog item is published.
- Effort, estimated complexity in story points that are necessary for the development of the backlog item.
- Risk, estimated risk level impacting either the development or business side of the product.
- KANO evaluates the necessity of the backlog item from the user’s perspective.
- MOSCOW indicates if for the user the backlog item is must, should, could, or even did not wanted.
- Readiness, a flag specified by the team to guide the product owner to improve the definition of the backlog item.
- Impediment, a flag indicating a blocker in the development of the backlog item.
- Waiting, a flag indicating waiting for somebody hence stopping the production of the backlog item.
- Estimated time, the time estimated by the team to implement the backlog item.
- Remaining time, the time necessary to complete the item which is in progress.
- Spent time, the time that was spent by the team while developing the item.