Release Burn Down Chart
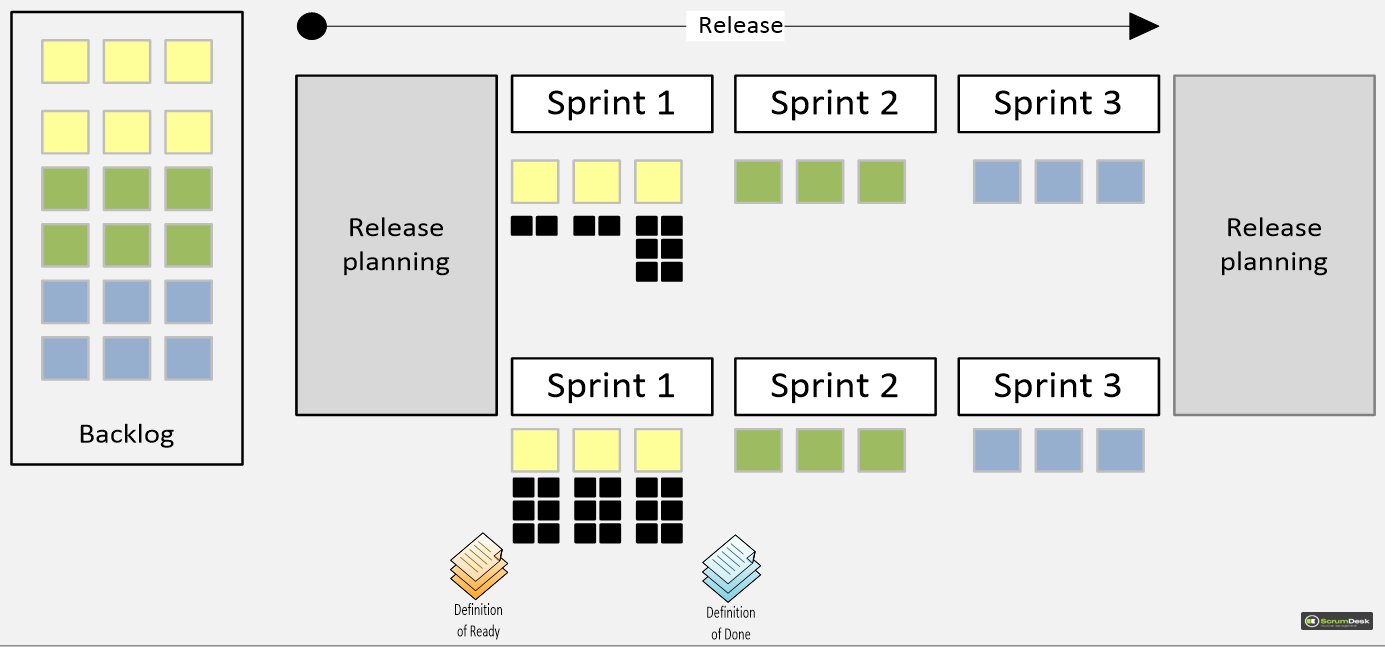
Long term planning in agile is done in releases which are longer timeboxes delivering value in multiple sprints. These release cycles are not mandatory deployment cycles. During the one release cycle can be more deployment cycles, i.e. at the end of every sprint, or even daily.
Similar to the sprint burndown chart, the release burndown chart displays remaining work in the release over time.
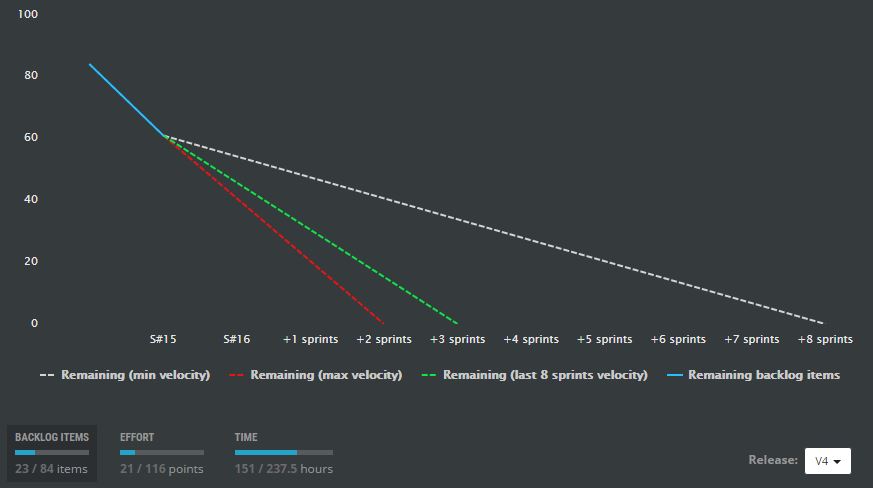
On the chart you will find:
- All release sprints on the X axis.
- The number of backlog items, or total effort in story points, or remaining time on Y axis (based on the switch below the chart).
- Real line displaying remaining work with blue color.
- Estimated duration of the release based on team velocities:
- Red velocity is the maximum velocity.
- Gray line represents the minimum velocity.
- Green line represents velocity of the last 8 sprints.
With these lines you can predict how many additional sprints you need will to finish the current release backlog.