The Cumulative Flow Chart
This chart displays the progress of activities done in the sprint. The cumulative flow chart is used mostly by Scrum Masters of Kanban and Scrum teams to find out the bottlenecks in the agile process.
The chart can be found in the REPORTS section of the application.
- On X-axis are displayed dates from the selected date range specified.
- On Y-axis is displayed the number of tasks in a given status.
- Every status is represented by the chart area displayed in the status color.
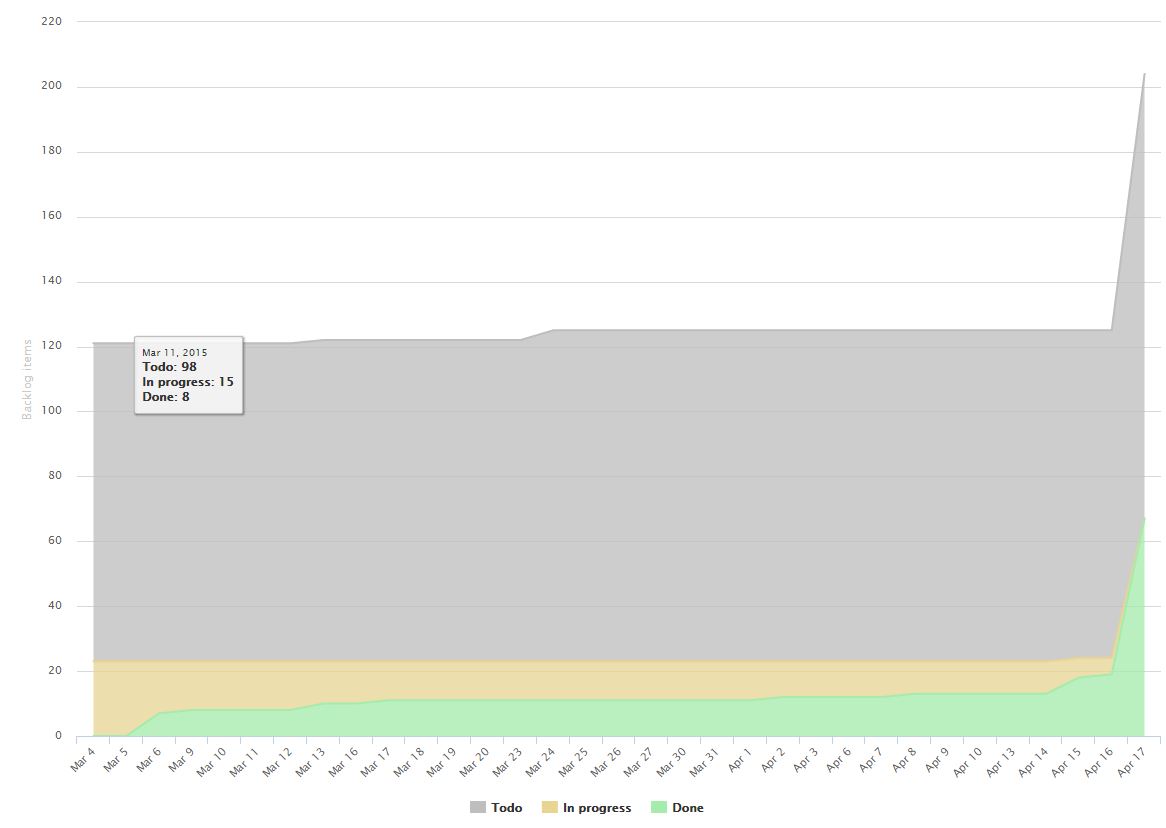
How to read the chart?
Bottlenecks will be represented as narrowed chart area for a particular state. The total number of tasks should be constant in Scrum during the sprint. At least by theory. In reality, however, changes are more often and therefore you will be able to observe when new sub-tasks were added into sprints and impact of this to a possibility to finish them.
If in progress area has mostly the same size for all days, then your team is quite impressive as they are probably working with the same effort over time.