ScrumDesk analyzes agile practices applied by teams and helps ScrumMasters to identify gaps quickly. These tips and findings of BurnDown charts are based on our 14+ years of agile coaching. Check additional metrics that ScrumDesk helps to track.
Burn Down Chart is a primary scrum metric used to track the implementation progress of the agile project. The burndown chart shows the amount of work remaining over days of a sprint. Scrum teams use the Burndown chart not just once per day. Ideally, it is used even by the Product Owner to understand how is the planned sprint backlog being completed. The burndown can be used to predict when the planned scope should creep.
It is suggested to track the release burndown chart and sprint burndown chart. Alternative to the burndown chart is a burnup chart that shows work completed per day.
How to draw the Burndown chart?
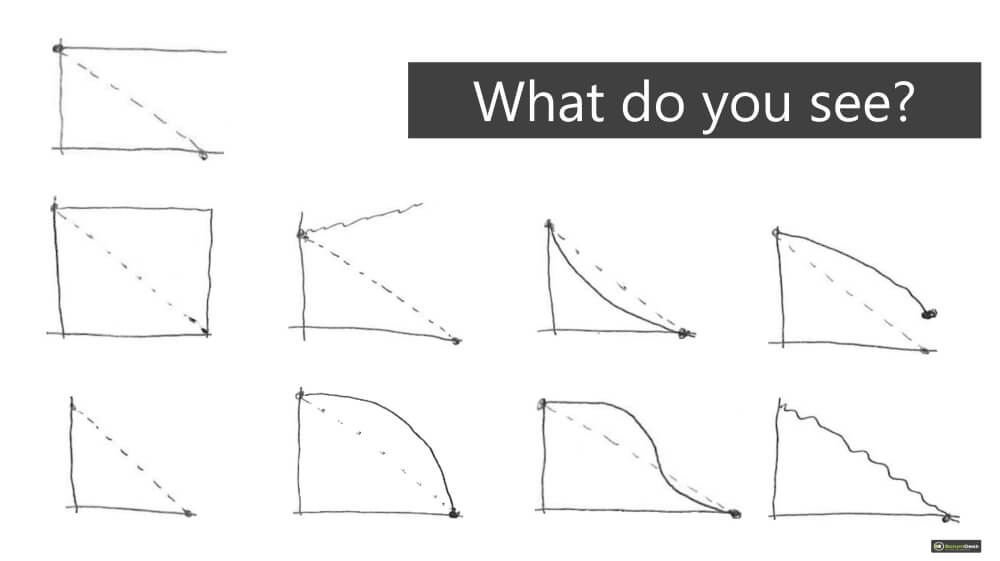
The BurnDown (or Burn Down) chart is simple:
- The horizontal axis displays days of the sprint.
- The vertical axis displays effort (story points or hours or days depending on what you prefer).
- The ideal line that visualizes expected progress.
- Real line visualizing the current progress.
The burndown chart is easy to explain, easy to be updated daily, easy to be analyzed. But do your team members really understand it? Are they able to read it?
Burndown Chart Variations
There are also other burndown chart variations used in real-life. Some scrum teams prefer to have a burndown chart that shows the number of tasks, while other scrum teams prefer the burndown chart that shows a number of user stories (backlog items) done over time.
The BurnDown chart showing the progress of the sprint is called the Sprint BurnDown Chart. This agile project metric can be used to track releases or program increments. as well. In this case, you can find the Release BurnDown chart in tools.
Ideal team burndown chart
Once you see such a BurnDown chart, congratulate the team. The burndown chart shows:
- They are doing a great job.
- Not over-committing work.
- Tasks were not completed late.
- The task was not completed too early.
- The team is on-time.
- Masters of the discipline, the team updates the progress regularly which gives everybody huge transparency.
What to improve?
Just continue!

Great team burndown chart
This is a typical burn down chart you can see in many already experienced team.
- A team is committed to a goal.
- They adapt the scope in case of need (as visible in the midst of the sprint).
- Team improves the speed to get things done.
- Team asks and reflects “How are we going to complete the sprint?”
What to improve?
Grab additional stories from the next sprint that your team is able to finish in the sprint.

Nice team burndown chart
This is a typical BurnDown chart you can see in many agile teams. Be aware that it doesn’t mean low quality of agile. If they still deliver the most valuable backlog items according to priority, they are still great. Anything uncompleted can be completed in the first few days of the next sprint. Especially, if the team is able to deploy finished backlog items anytime, there is no problem at all here. You will just get results a couple of days later. Not so bad compared to the waterfall, isn’t it?
The burndown chart shows:
- The team is committed to the sprint goal.
- The scope is partially adapted when needed.
- The team improves the velocity to get things done.
- The team reflects and asks “How are we going to complete the sprint?”
What to improve?
Stop in the middle of the sprint and discuss how to get back on track. Something with lower priority should go out of your current sprint backlog, or the Product Owner can simplify requirements, or alternatively, the work can be done in simpler way.

The burndown chart: Let’s take a rest, team!
This BurnDown chart indicates your team is fine to have time to rest. Except of great progress, the burndown chart shows:
- The team has finished work earlier than expected but could finish more.
- Maybe there are not enough items in the sprint backlog. Is anything prepared for the development in the product backlog? Not? Hey Product Owner, wake up. It is time to provide food to your team!
- Is the team larger than it was expected at the beginning of the sprint?
- Stories might be overestimated. Update your estimation to have more precise numbers for your statistics. That helps improve your estimation in upcoming sprints later on.
What to improve?
Get additional stories as soon as possible from the next sprint according to priorities.

Oh, the management is coming!
Hey, team, you are not doing what is necessary! Where are you heading to? How do you know whether you are able to finish the sprint on time? Your BurnDown chart says the truth. The burndown chart shows you clearly everyday:
- Maybe the team is doing work, but there is someone adding an amount equal to completed work.
- The team doesn’t update the remaining time regularly.
- Send Scrum Master and team back to training classes.
- Maybe stories were overestimated.
- The product owner doesn’t take care as well.
What to improve?
Stop the line after seeing line of 3 days in a row. Initiate retrospective immediately.

Do your duties, dudes!
Hey, team, this is even worse. Maybe you completed something but completed work is not visible as progress on the BurnDown chart!
- See Oh, management is coming! chart.
- Sprint might be still in progress.
What to improve?
Restart. From scratch, from the training. Do retrospective to figure out why is this happening.

Zero effort!
The BurnDown chart indicates:
- Stories/tasks were not estimated in the sprint planning meeting.
- No story or task in the backlog.
What to improve?
Estimate stories/tasks immediately and update your backlog. Do not forget to start sprint if you use the electronic tool like ScrumDesk.

The burndown chart ‘Up to the sky’!
The first sprint in your life? Seems like yes. In this case, such a BurnDown chart is acceptable :).
- Stories/tasks are added into the spring backlog continuosly.
- More work is added than completed.
- Tasks are re-estimated constantly.
- You will never be able to complete the sprint if you will not fix the way of working first.
What to improve?
Estimate stories/tasks immediately and update your backlog. Do not forget to start the sprint if you use the electronic tool.

Boom. It is too late!
This Burn Down chart says: “You did not complete your commitment”. And you were late all the time.
- Tasks not completed.
- Adaptation not done during the sprint.
What to improve?
Check if the size of the sprint backlog is not growing. Stop the production line as soon as possible, before the sprint ends. Remove low priority stories from the sprint.

Boom. Too early!
This BurnDown chart says: “You have completed your commitment earlier than expected”. What to do now?
- Stories were under estimated.
- The low commitment of the team.
- Incorrect sprint capacity calculation.
- Stories are not grabbed from the next sprint.
- Some team members do not have tasks assigned.
What to improve?
After two or three days Scrum Master should ask if there is anything team can do from the next sprint. If yes then assign

There is a bump on the road!
Burn up first, then urn down.
- Stories were not estimated at the beginning of the sprint.
- Stories were added till mid the sprint.
- Appropriate recognition of the incorrect situation in the mid of the sprint. Positive, but late.
- Lost guidance on how to get to zero.
What to improve?
Restart your sprint by the planning session.
