Capacity indicators
The great scrum team wants to deliver the working products every sprint. But how much should you plan for the sprint? Statistics is a great tool to answer this question. Once your team has some history of previous sprints, ScrumDesk helps product owners answer that question pretty straightforward.
When you plan a new sprint, capacity indicators are displayed in the sprint panel in PLAN view. The product owner knows to plan the only necessary amount of the work which can be completed compared to the history of the team.
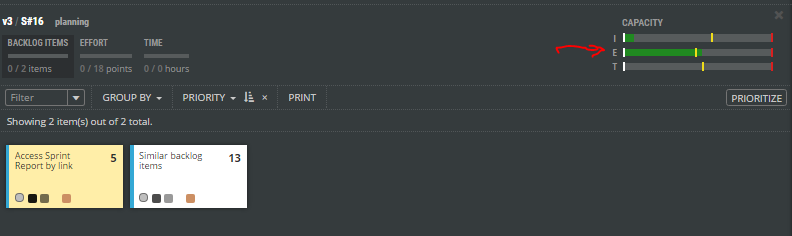
Capacity indicators display three values:
- I – number of items which are planned for the sprint,
- E – an effort that needs to be done to finish user stories. In story points.
- T – the estimated time necessary to finish user stories assigned to a planned sprint. In hours.
Why there are three indicators?
Some teams estimate by time, some prefer story points while others just a number of cards. Having all three you will be able to plan sprint comfortably enough.
The green bar indicates a particular value in the planned sprint. It is changed once you assign backlog items into planned sprint either via drag and drop or by the change of sprint in the side view.
Every progress bar has three markers:
- The white bar indicates the minimum value achieved in previous sprints.
- The yellow bar indicates the mean value achieved in the last 8 sprints.
- The red bar indicates the maximum value achieved in previous sprints.