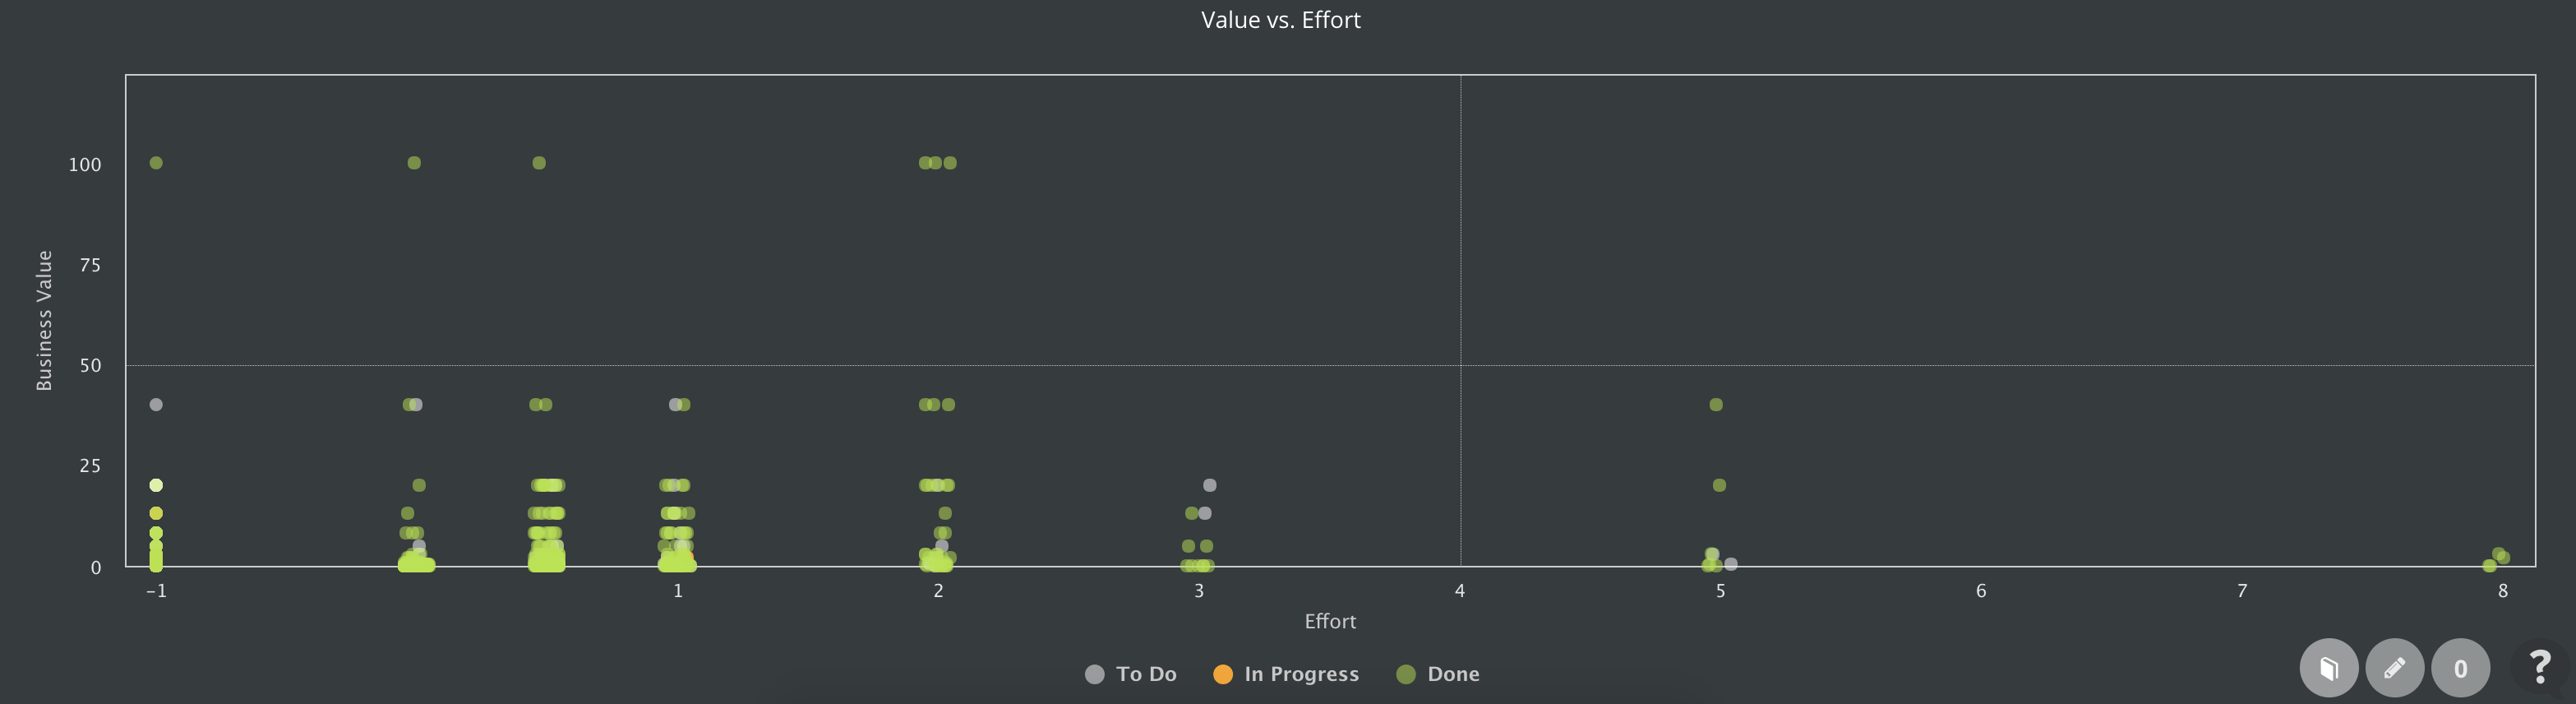
Value vs Effort chart
What is worth to invest to develop as the first? The ultimate question of any Product Owner. Product ownership has multiple ways how to answer that questions.
There are a lot of perspectives but the simplest one is to compare the expected business value with the effort necessary for the implementation.
Report Value vs. Effort distributes backlog items into segments:
- Backlog items you should prepare are displayed in the top right area. With high business value and high effort. These should be broken into smaller parts.
- Backlog items you should start with are displayed in the left top area. With the highest business value and low effort. These win customers.
- Backlog items that can wait are displayed at the bottom left area. With high low business value and low effort. Postpone them to your backlog.
- Backlog items that you should consider to not develop displayed at the bottom right area. With low business value and high effort. Forget about them.
Report Value vs Effort
Click dots to see further details of backlog items. Dots are slightly distributed so you can distinguish them and click the proper one to display its properties.
Selection by mouse will zoom the chart.