Release date: August 19, 2008
Version 3.6 is a major upgrade. This version makes version 3.5 changes available to the public + new features listed below. We focused on a better
visualization and features requested by our customers. If you are using a local database installation, then a database upgrade is required.
Only database version 2.13.0 is supported.
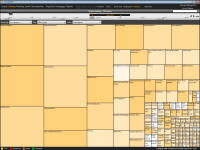
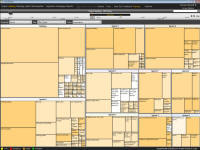
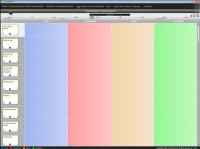
| Stories Treemap
Treemap is a great way to visualize a project backlog or sprint backlog. ScrumDesk in the next version will provide a view using three parameters:
Using these parameters you can change the perspective of the treemap’s view. |
„ Features on 3.6 look great can’t wait to upgrade from our 3.1, at least to 3.5 for the exports. Showed the team the features, they were equally excited to try them out. ” |
|
Kevin Jones Technical Samurai, Twisted Studio Ltd |
||
| „That treemap looks awesome!”
Cecilia Abadie |
||
| See the product backlog in Groups | See the product backlog by Size | See the product backlog in colors |
|
|
|
Treemap enables to the analysis of all backlog stories in one place. Concentrate on the size and you will see your top stories. Concentrate on colors and you can see priority, darker orange, higher priority, white is the lowest priority.
Concentrate on size and color and you can quickly find top priority (dark orange color) story that is hardest to complete (it is biggest because size is effort).
You can group stories by Release or Sprint and the size of the group is the size of your work that must be done. The detail of the story can be displayed by clicking on the rectangle. You can read more about the treemap’s usage in the blog entry by Mike Cohn.
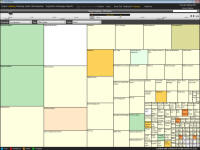 No groups, size of rectangles by story points, color by cards’ color |
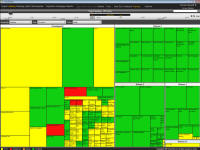 Group By release, size by estimated duration, color by story state |
 Group by theme, size by estimated duration, color by story state |
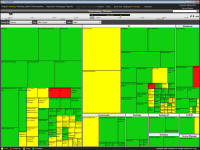
 No groups, size by effort, color by priority |
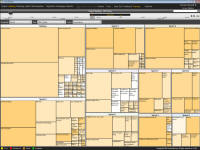 Same as on the left picture, grouped by sprint |
 Group by the team, size by remaining duration, color by story’s state |
 Group by theme, size by remaining, color by team |
 Group by sprint, size by effort, color by priority |
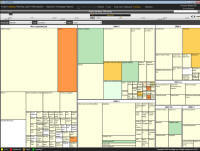 Group by month, size by estimated duration, color by story card’s color |
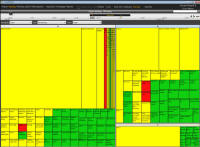
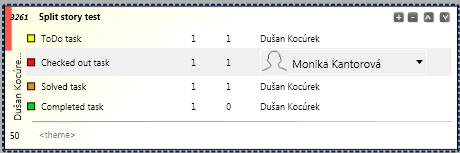
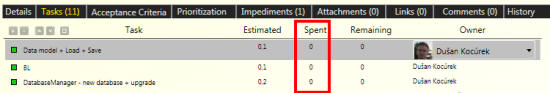
Taskboard
Taskboard is useful to display the current sprint status during the daily meeting. Tasks are displayed in swim lines by state. The story is displayed in the first column. The state of the task can be changed by drag and drop between columns. If it is now possible to change status, a stop cursor appears.
 Stories and their tasks, tasks are not started Stories and their tasks, tasks are not started |
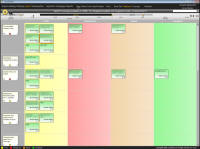 Some tasks are checked out, some are solved and one is completed Some tasks are checked out, some are solved and one is completed |
This view enables users to add new stories and tasks, remove them, and display details. A new task can be easily added by pressing ![]() button that is displayed if the mouse is hovering on the column ToDo.
button that is displayed if the mouse is hovering on the column ToDo.
If the user hovers the mouse over the task, the delete button and task operator’s picture will appear.

Double click on the task displays Task detail. The header of the task board displays the name of the state, an overview of the remaining/estimated duration, and a number of tasks.
![]()
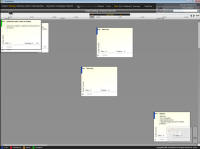
Task detail
The task can be edited in the new Task detail window. On the bottom of the window is a hyperlink that will access the detail of the task’s story.
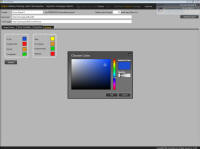
Customizable status colors
The status indicator’s color can be customized. ScrumDesk supports customization story’s, task’s and retrospective ideas state color. Color can be changed to the default value by clicking on the Default button. Colors are customized by a project.
 Setting a new color – blue – for state ToDo |
 The blue color is displayed in card’s top-left rectangle indicating ToDo status |
 The blue color is displayed in new Taskboard as column background also |
Impediments list
All impediments are accessible in one place now. Use button in Timeline and Impediments Summary will appear. Click on the colored rectangle to change the status of the impediment.
 |
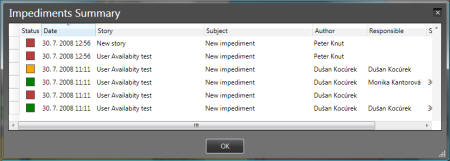 |
| Start impediments list by clicking on button I | Impediments list displays impediment’s status, date, which story is related to impediment, subject, author, and other impediment’s properties |
Splitting
Story and task can be split by drag and drop to the next sprint (rectangle in the timeline). The state of the non completed tasks is changed to ToDo.
Example: Dragged story contains 4 tasks. Completed tasks will not be split. State of other tasks is changed to ToDo and the remaining time is adjusted (uncompleted part of work is set as estimated duration).
Not completed story which is going to be split.
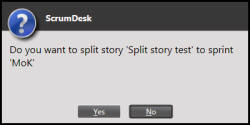
ScrumDesk is asking if you want to move the whole story to the next sprint or you want to split this story.
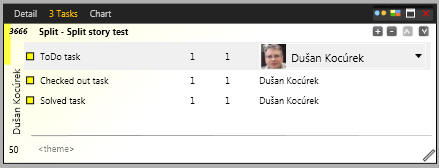
After drop is a new story is created in the next sprint. This story contains only non completed tasks. The estimated duration of tasks is adjusted.
Other improvements
 |
Quick Filter
On the upper right side below the project’s name is accessible QuickFilter. If stories are filtered, the orange glow effect will indicate this situation. Button X can be used to remove the filter. |
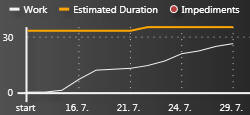 |
Burn Up chart
Some customers prefer the Burn Up chart. Burn up chart is displaying the sprint’s duration and work done on a given day. We will publish some screenshots soon. Burn Up chart is accessible by SideView and Reports. |
| View Filters
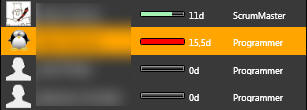
Every view (backlog, sprint, retrospective) can have defined its own filter. The filter is automatically applied by switching to view. Last display mode Backlog, Sprint, and Retrospective can be displayed by different modes – grid, board, taskboard, and treemap. View automatically displays stories by last used User workspace ScrumDesk is saving view’s filter and current view for every board (Backlog, Sprint, Retrospective). Saved workspace is applied after the ScrumDesk starts. Member’s remaining time indicator Version 3.5 displayed member workload relative to each other team member. Version 3.6 is indicated by progress color:
Planning viewIt is possible to fully manage stories in Planning view. You are able to create new stories, delete them, or create copies by drag and drop (+Ctrl). Commands New and Delete are enabled by sprint state. If a sprint is done, it is not possible to use them. Minor changes
|
|